This topic might not be everyone’s cup of tea, but as someone who has been fascinated with number, particularly number sequence for most of my conscious life, this brings me much joy. And if you are reading this, then chances are you have spent time analyzing live-stock charts or wondering what the heck they mean, and during a volatile trading session the curiosity is even more amplified, you know precisely what I am saying. You are watching a jagged red and green line violently spike up and crash down, looking less like a logical financial instrument and more like a heart monitor attached to someone having a severe panic attack.
To those unfamiliar with market dynamics, the stock market is pure, manic chaos. More like random collision of headlines, algorithmic trading bots, and terrified retail investors hitting the “sell” button.
Obviously, market dynamics evolve over time, but the core structure has remained pretty much the same for quite some time and that is, although the market tend to have somewhat of a randomness to it, it isn’t random at all? But what if, beneath that chaotic surface, the financial markets are moving to a specific, rhythmic mathematical code—a code that has been dictating the natural world for millennia?
I know, I know. It sounds like woo-woo, crystal-gazing nonsense. You came here for hard financial talk, not a philosophy lecture. But before you roll your eyes and click away, hear me out. Wall Street’s heaviest hitters have been using these exact mathematical principles to find market bottoms, predict massive breakouts, and make absolute fortunes.
So, I want to take you into what I consider the fascinating intersection of investing and sacred geometry.
What Exactly is Sacred Geometry?
Before we start applying this to your portfolio, we need to understand the concept. Sacred geometry is an ancient mathematical and philosophical framework based on the idea that specific shapes, proportions, and patterns are the fundamental building blocks of the universe.
And this just about abstract math here. The ancient Egyptians used these exact geometric ratios to align the Pyramids with absolute, mind-bending precision. The Greeks, specifically thinkers like Pythagoras, realized that these numbers dictated the harmonic frequencies of music.
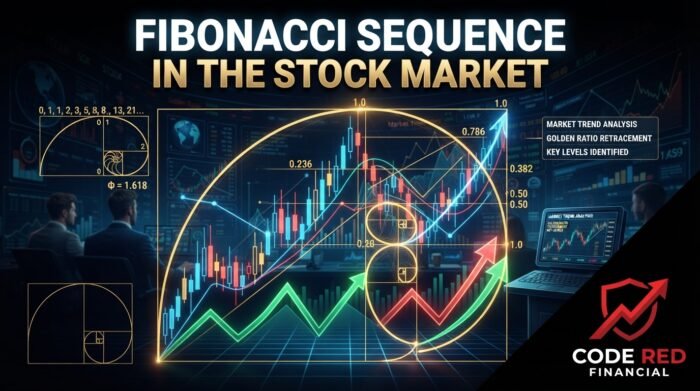
At the core of all this is the Fibonacci sequence—a series of numbers where each number is the sum of the two preceding ones (0, 1, 1, 2, 3, 5, 8, 13, 21…). If you divide a Fibonacci number by the one immediately before it, you get closer and closer to 1.618.
This is the Golden Ratio.
The Golden Ratio dictates the spiral of a hurricane, the curve of a nautilus shell, the way a fern unrolls, and the exact proportions of the human body. It is nature’s blueprint for optimal growth and efficiency. And here is the kicker: because human beings are part of nature, human psychology moves in these exact same mathematical waves. When millions of humans buy and sell assets driven by fear and greed, they unknowingly paint the Golden Ratio right onto the stock charts.
Core Investment Strategies to Pair With Geometric Patterns
Before you can start drawing spirals on your brokerage screen, you need a foundational strategy. Think of your core strategy as the engine of your car, and geometric patterns as your GPS. Generally speaking, your money is going to be doing one of three things:
- Passive Investing: This is the “buy and hold” crowd. You are buying broad index funds or ETFs and riding the macro-economic wave. It is hands-off, low-stress, and relies on the fact that, historically, the market always goes up over a long enough timeline.
- Value Investing: This is the bargain-hunting approach. You are digging into balance sheets and financial metrics to find companies that the market has completely mispriced. You are buying a dollar for fifty cents and waiting for the rest of the world to wake up and realize the true intrinsic value of the asset.
- Growth Investing: Here, you are looking for the absolute rocket ships. You don’t care if the stock looks expensive right now; you are betting on massive revenue growth, market disruption, and innovation. It carries a much higher risk, but the payout can be life-changing.
Whatever your foundational approach is, sacred geometry doesn’t replace it—it supercharges it. It tells you when to execute.
Fibonacci Retracement
So, how does a nautilus shell help you buy tech stocks? It all comes down to human emotion.
Financial markets never move in a straight line. They breathe. A stock will surge upward (breathing in), and then it will inevitably pull back as people take profits (breathing out). But how far will it pull back before it shoots up again?
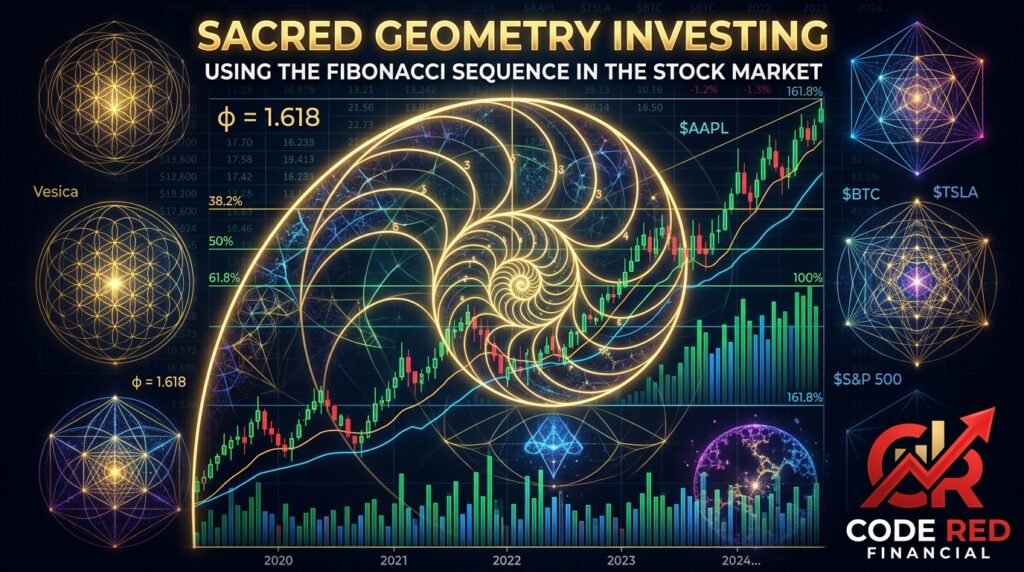
This is where the Fibonacci retracement tool comes in—a staple on virtually every trading platform in the world. Traders use the Golden Ratio and its derivatives (like the 38.2% or 61.8% pullbacks) to predict the exact levels where a falling stock will suddenly find “support” and bounce back up. It is entirely based on the premise that mass human psychology will correct itself in a naturally occurring, geometric rhythm.
When a stock pulls back to that 61.8% line, the selling exhaustion perfectly balances with the buyer demand. It is market harmony. Traders use these ratios to snipe the perfect entry points for their long-term growth or value plays, minimizing their risk and maximizing their upside.
Successful Investors Using Stock Market Patterns
If you think this is just a theory for day-trading hobbyists, look at the titans of the industry who have built empires on these patterns.
Take Robert Prechter, the famous market analyst who popularized the Elliott Wave Theory. Prechter’s entire thesis is that the stock market moves in fractal, geometric patterns—specifically, five waves up followed by three waves down. By recognizing where the market is within this repeating geometric structure, Prechter has been able to call massive, macro-economic market reversals that completely blindsided traditional analysts.
Then you have guys like David Einhorn, the billionaire founder of Greenlight Capital. While Einhorn is famous for his ruthless fundamental analysis, his approach mirrors the search for the Golden Ratio. He dissects a company’s financial architecture, looking for the underlying patterns and structural imbalances that the rest of Wall Street is ignoring. When the financial math doesn’t align with the stock’s geometry, he strikes, resulting in legendary long and short positions that have netted massive profits.
And look at Mark Minervini, one of the most successful stock traders of our generation. Minervini doesn’t just guess; he uses a highly systematic, geometric approach to identify visual patterns on a chart—like triangles and “cup and handle” formations—that precede massive price explosions. By combining raw technical geometry with standard investing principles, he famously achieved returns exceeding 3,000%.
How to Build Your Own Sacred Geometry Investing Strategy
You don’t need a PhD in mathematics to start using this. If you want to start layering sacred geometry into your own financial strategy, you just need to change how you look at the screen.
Start by looking at historical price charts—specifically candlestick charts. Open up the tools on your brokerage app and overlay a Fibonacci retracement on a stock that recently had a massive run-up. Look at where the price pulled back and stopped. I guarantee you will be shocked at how often the stock price bounces cleanly off the 61.8% or 50% lines as if hitting an invisible brick wall.
What you are looking for are “confluence zones.” This is when multiple indicators align perfectly. If you have a fundamentally strong value stock that has pulled back exactly to a key Fibonacci level, and it coincides with a historical geometric support line, the math is screaming at you that the risk-to-reward ratio is in your favor.
The Risks of Market Patterns
Now, let me hit you with the cold water, because I refuse to sell you a fantasy.
Sacred geometry is a tool, not a crystal ball. The biggest danger in this kind of analysis is a psychological phenomenon called apophenia—the human tendency to see meaningful patterns in completely random data. If you stare at a chart long enough, you will convince yourself you see a golden ratio forming, even if it’s just noise.
Furthermore, geometry cannot predict a black swan event. A Fibonacci sequence isn’t going to save your portfolio if a CEO gets indicted for fraud, if a geopolitical war breaks out, or if inflation reports shatter expectations. The markets are dynamic, heavily manipulated, and often wildly irrational. If you rely solely on geometric patterns without understanding the underlying business fundamentals, economic data, or having a strict stop-loss in place, the market will gladly take all of your money.
You have to maintain a balanced approach. Use traditional, cold-blooded analysis to figure out what to buy, and use the natural geometry of the market to figure out when to buy it.
Embracing the Natural Rhythms of the Stock Market
We spend so much of our financial lives fighting the market, stressing over every dip, and letting our emotions drive our decisions. But when you start viewing the markets through the lens of sacred geometry, that anxiety starts to fade.
You begin to realize that pullbacks aren’t necessarily a sign of the apocalypse; they are just the market breathing out. The chaos starts to look like a cycle. By embracing these ancient, natural patterns, you stop reacting to the market out of fear, and you start moving in rhythm with it. You aren’t just blindly throwing money at a ticker symbol anymore—you are participating in a mathematical cycle of prosperity that has been running the world since the beginning of time.
What about you? Have you ever noticed these repeating patterns when you look at your portfolio? Do you use Fibonacci levels to time your buys, or are you strictly a fundamental, buy-and-hold investor? Drop into the comments below and let’s talk about how you map out your market moves.
Disclaimer: This article is for informational purposes only and does not constitute financial or investment advice. Consult with a qualified financial advisor or tax professional before making any decisions about your investments or retirement accounts.
Jay Sadio, MBA